Category Archives: cold spell

January 2019: rather cold, dry

January was most notable for being on the cold side, in contrast to December.

The mean temperature finished 4.1C, 1.1C below average, over 2C colder than last January.

Some 32.9mm of precipitation was recorded, 62 per cent of the 1981-2010 average, about half what fell last year, the driest January since 2006

Some 55 hours of sunshine were recorded, that’s 109 per cent of average, sunnier than last year.

Fourteen air frosts were recorded.

There were four days where snow fell but only one day of snow lying, 1cm on 23rd.

To view full stats follow this link:http://1drv.ms/1kiTuzv

My winter forecast went a bit awry in December – I predicted a mean of +0.8C, the outcome was +1.7C. January has been much better, I predicted -1.2C, the outcome is -1.1C! Also… “And another cold spell end of January into the first week of February?”
For February I predicted a mean of -1.7C. The current pattern to continue and signs on the EC of a more robust cold spell with air supplied by a Scandinavian high?

Update on effects of the polar vortex split

More than three weeks have now past since the polar vortex split on January 1st.

London’s weather has turned colder and there’s even been a (small) fall of snow but the negative anomalies recorded so far are less than those experienced during the ‘Beast from the Eastevents last March.

In the graph below I have plotted the mean anomalies since the day of the PV split against the mean anomalies recorded from the day of the PV split in February 2018.

The effect this year is much less pronouced so far: over the last 24 days the average mean anomaly has been -0.7C, compared with -2.1C last February/ March.

jan 2018 2019

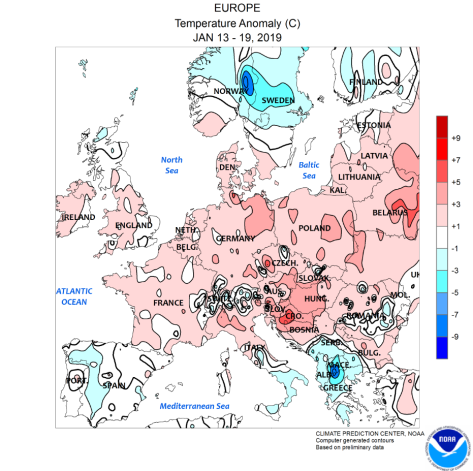
The NOAA anomaly map for the week of January 13th-19th shows much of NW Europe has experienced a positive anomaly with any serious cold restricted to Norway and Sweden and Greece.anom jan 13th to 19th

It has been mentioned that the variables with this SSW are very similar to 2004. Using the anomalies generated after the 2004 event resulted in the graphic below.

3 years compared

Taking it at face value would suggest that two more snow events could be possible at the beginning and middle of February – a cold but not severe pattern currently reflected in the models – but forget any repeat of last year’s Beast from the East.

Halfway through winter: where’s the snow (again)

Five years ago I blogged about the lack of snow at the midway point through winter. This winter there has been a similar total lack of snowfall though this time it is benign anticyclonic conditions that have characterised the past 45 days rather than the raging zonality of the winter of 2013/14 which ended completely snowless in this area.

A look at the statistics reveals that the midway point of winter is the mildest for 3 years and the 6th mildest since 1960. There has also been around half the rainfall that we had to this point in 2018. Sunshine is similar and below average.

Since December 1st, Wanstead has recorded just 7 air frosts – 5 fewer than last year. The coldest night was just -2.5C. The current mean temperature this winter to January 14th is 6.9C with rainfall 60.6mm.

Further scrutiny of stats for the Wanstead area reveal few years were similar to this winter. Using my method for finding patterns stretching back over 50 years to forecast this winter I picked out years that were +/- 10% of the 2018/19 rainfall total. From these I then weeded out the seasons where the mean was within +/- 10% of the this year. This gave a list of three winters with similar temperature and rainfall.

50%

The other winters weren’t anything special with ‘snow lying’ days below the median for this area of six.

nevis
Snow go: just patches of snow were visible on the upper runs of Nevis Range at the weekend on Jan 12th

As I write there are signs that the weather is going to turn colder this week. Whether it will be cold enough for snow remains to be seen though the ECM model is hinting at a rise in pressure around Greenland. A situation that *could* be conducive for something colder long term.

In summary, the probability at this point of at least one fall of snow before the end of February could be put at 100 per cent. Whether it will be abundant or merely a dusting is impossible to tell.

Elsewhere in the UK it has been similarly lacking in snow. During a visit to Fort William at the weekend locals told me that there has been no significant snow since October / November and that even frosts were few and far between. The lifts around Nevis Range looked forlorn against a green backdrop. And it wasn’t until I got to the summit of Ben Nevis and Aonach Mor that I saw any of the white stuff.


‘So much for global warming…’

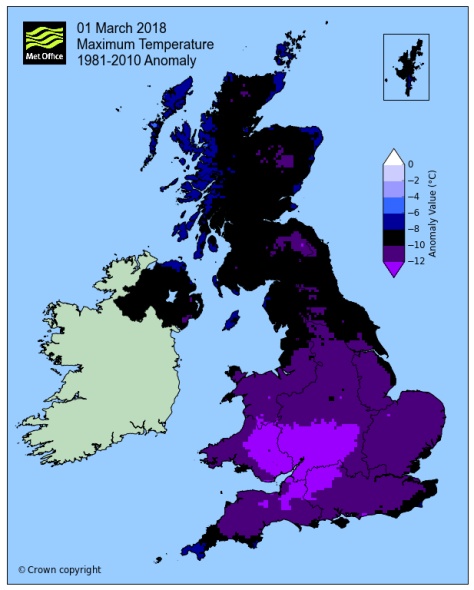
Since notably cold weather struck at the end of February I’ve lost count of the number of times I’ve heard this phrase uttered by the public and some sections of the press.

Top 20 cold
Top 20 cold anomalies

The ‘Beast from the East’ (versions 1.0 and 2.0) really captured the imagination in an age where everything has to have a label slapped on it; any message that these cold spells are ‘weather’ and not ‘climate’ seems to get lost.

Both spells, indeed the general pattern of our late winter weather, were driven by the stratospheric sudden warming event that lead to a split polar vortex in February – leading to a very cold end to the month and a mean temperature anomaly of -2.5C, the greatest monthly anomaly since March 2013.

To put it into perspective, however, it was nothing like some of the anomalies that occurred in the early 19th century: January 1814, for example, saw a monthly anomaly of -8.2C and coincided with the last occasion a frost fair was held on the Thames. Januaries back then were generally very cold, the 1801-1831 average monthly mean was -3C, that’s 8C colder than the most recent 1981-2010 average!

So climate now is much warmer but that is not to say that anomalously cold months can’t happen. February 1986 saw an anomaly of -5.6C, the 13th= greatest cold anomaly in my local dataset going back to 1797.

top 20 warm
Top 20 warm anomalies

The cold December of 2010 recorded an anomaly of -4.2C, 76th= greatest cold anomaly, while anomalies of -4.1C recorded in January 1979 and March 2013 were 77th=.

With the warming climate it is no surprise that most warm months happened very recently. The balmy month of December 2015  saw a positive anomaly of 5.4C.

The ‘Beast from the East 2.0’ was caused by a narrow tongue of extremely cold air from Russia scoring a direct hit on the UK. The odds of this happening must have been low but it is an example of how, when the synoptics of the atmosphere line up perfectly, anything is possible.

And it is an example how even in a warming climate the UK can still be subject to anomalous cold and warmth at any time of the year.

As the author Mark Twain reportedly once said: “The climate is what you expect; the weather is what you get.”

gfs
The upper air anomaly of the ‘Beast from the East 2.0’. 
anom
This graphic shows positive and negative monthly anomalies since 1797 against a generally warming climate

Because the above graphic is crowded I created one of anomalies since 1970. The upward trend is the same.

1970

march 1st

Beast MkII or just a late March cold spell?

After the severe spell at the end of February that lasted into this month there’s lots of excitement / dread (*delete as appropriate) that the synoptic conditions that brought very cold air from our east is about to return.

The latest run on the GFS model shows that very cold air (-10C at 5,000ft) could be over us by next Sunday, with the ECM 12Z operational looking particular cold. ec

Snow this late in the year is very rare in the London area though, if the conditions are right, a blizzard is not impossible, as happened during the spring of 1952 when a two-day blizzard at the end of March brought drifts up to 6ft deep in the Chilterns.

Much more likely will be severe, possibly record breaking frosts. The coldest March night since 1959 across the London area occurred on the 3rd in 1965 with -7.4C recorded at Heathrow. Central London fell to -5C on the same night.

A look back at cold spells in March reveals that while snow was very scarce in London and the Home Counties it can be common on high ground from the Peak District northwards.

A history of March cold

1812: Luke Howard in The Climate of London noted that “great inclemency of the weather” on the 21st March disrupted mail deliveries between the north of Scotland and  Carlisle. The road between Appleby and Brough was impassable because of snow and between Sheffield and Manchester and Bradford and Halifax the snow had drifted from “two to three yards deep”.

Mail deliveries were also disrupted across South Wales.
In Plymouth a “a most tremendous gale from SW the whole of last night and this morning” brought flooding.
Howard’s account would confirm a classic battleground scenario of mild Atlantic air from the south pushing against cold Polar continental air in the north.
His own records from Stratford show a couple of cold days from the 16th, highs never lower than 2C, the coldest night on the 24th, being -4.4C. On the 20th he mentions snow in the morning followed by rain.
Wanstead mean: 4.9C (-2.8C) rainfall: 74.4mm (183%)

The following accounts of cold spells in March are recorded on the site London Weather.

1962: The first ‘spring’ month was colder than any month during the preceding winter. Frosty nights were much more frequent than normal, and sleet or snow fell on 10 days, although amounts were often trivial . On the 5th, the maximum temperature was only 2.2 C. Towards the end of the month, north to northeast winds were replaced by somewhat, cloudier milder, and moister south-westerlies. Atlantic fronts brought rain bands, and on the 29th nearly 10mm was measured.
Wanstead mean: 3.3C (-4.4C) rainfall: 36.5mm (90%) sun: 95.4hrs (88%)

1964: The first week of March was mostly cold with wintry showers and a fresh northeast wind. The temperature on the 7th only reached 2.3C. The second week was changeable and milder, and the high on the 13th was near 14C., but on the 15th, rain turned to sleet and gave a total of 26mm as cold air slowly encroached from the east. Nearly 15mm of rain fell on the 19th as milder air returned, but the rest of the month stayed mostly rather cold and changeable.
Wanstead mean: 4.9C (-2.8C) rainfall: 80.4mm (90%) sun: 63.5hrs (58%)

1969: The first week was mainly dry, and although dull and cold at first, it became fairly sunny and milder but with severe frosts. Overnight on the 6th/7th the minimum temperature was close to minus 8C. During the second week it became dull and wet, but after a cold start temperatures rose above average. Cold north-easterlies returned on the 16th with a high of only 3C., and cloudy, rather cold, and often wet, weather persisted until westerlies returned on the 29th.
Wanstead mean: 4.6C (-3.1C) rainfall: 53.2mm (131%) sun: 55.8hrs (51%)

1979: The first 12 days of March were changeable and windy with temperatures mostly above average. A wave depression formed on a cold front and produced 23mm of rain on the 13th, and as this depression became slow moving to the east of the country the rain turned to sleet and snow on the 14th, and continued into the 15th and 16th with highs near 3C. After mid month, the weather became less unsettled and milder, and the high on the 25th was near 15C.
Wanstead mean: 5.8C (-1.9C) rainfall: 96.5mm (237%) sun: 100.5hrs (92%)

1985: After a changeable start to the month, pressure built, and it became mostly dry, although often rather cloudy, with temperatures close to normal. On the 15th, showery rain turned to snow during the morning, and several cold and unsettled days followed. Sleet or snow fell on 5 days, and on the 21st the temperature failed to rise above 5C. Sharp frosts occurred, and although it then became less cold, the 26th was a miserable day with 11m of rain falling.
Wanstead mean: 5.9C (-1.8C) rainfall: 44.1mm (108%) sun: 100.5hrs (87.4%)

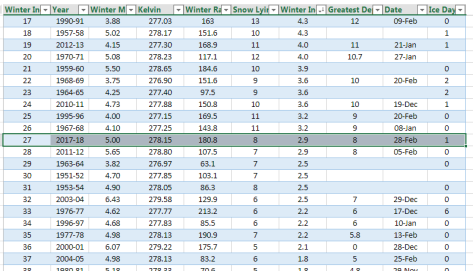
Winter 2017/18: 27th out of 72

A few years ago I devised a winter index to try to decipher how modern winters ranked against legendary seasons, such as 1947 and 1963.

With the media hyping conditions last week, which were severe in many parts of the country, it is very difficult for many to gauge just how conditions compare with previous winters.

My findings show that this winter so far stands 27th. It is possible that further snowfall that results in lying snow at 9am between now and April will boost the position higher though, given recent years, this would seem unlikely.

index

Last week’s cold spell, while containing some impressive statistics, is put into perspective when it is compared with other severe spells since 1960. A decent cold spell but no record breaker in the form of a 1962/63.

Perhaps it is the advent of social media, the plethora of constant updates of the latest feet-deep snowdrifts and instant tales of heroism in the face of icy adversity, that has made this cold spell seem far more severe than it actually was in the minds of many; February / March 2018 was the first truly social media-driven cold spell.

Record cold pools and snowfalls

This week has the potential to see new temperature records set or matched as very cold air moves in off the continent.

Whilst amounts and location of snow are very difficult to estimate at more than 24hrs to 48hrs away there is no doubt that the incoming air is very cold indeed.

In the early hours of Wednesday one weather model is showing extremely cold air (496-504 DAM ie very low thickness) just off the coast of Scotland. In the last 60 years there have been only three occasions where air approaching this thickness (500 DAM and lower) has been recorded in the UK:

February 1st 1956: Hemsby, Norfolk
February 7th 1969 at Stornoway, Outer Hebrides
January 12th 1987 at Hemsby.

thick
Radiosonde (weather balloon) ascents will make very interesting reading this week

With the deep cold air in place the potential for snowfall comes once the air starts to become unstable. East London, and much of the east coast, best falls come where convergence lines ‘streamers’ form.

streamer
One example of a streamer is forecast to occur on Tuesday

If persistent, these ‘Christmas tree’ features are capable of producing snowfall accumulating at the rate of 5–7cm per hour in especially cold
outbreaks, albeit often very locally. The steep thermal contrast between the very cold air and the current warm anomaly in the North Sea could make any snowfall very heavy indeed.

Streamers during the cold spell of January 1987 saw 30cm fall widely with some up to 65cm in Kent and 45cm in south Essex. Parts of Cornwall saw up to 40cm.

During a cold spell in February 2009 thundersnow was recorded – the favoured spot this time being parts of Surrey which saw 30cm.

Personally the most snow I have recorded during a cold spell was in February 1991. A very deep cold pool, not unlike what is forecast this week, covered much of the south. in air approaching 500 DAM. Days and days of snow followed dumping knee-deep powder in my local park in suburban East London. Reported depths included 20cm at St James’ Park in the centre of London, and 38cm at Rettendon, Essex.

There is a very good paper on cold pools and snowfall here.

beast


The most potent cold spells since 1960

‘This cold spell is rubbish compared to what we used to get!’
Every winter when weather model hype builds expectation for many, often days in advance, the outcome never seems to quite match the hype.

This expectation among weather nerds is inflated even further when the tabloids cotton on and build anticipation further only for it all to end in a ‘damp squib’.

I’ve lost count of the number of times when excited enthusiasts proclaim that an incoming cold spell is going to last at least three weeks; the reality being that the intensity of the cold has gone after four or five days. Cold spells since 2008 often arrive as a ‘blob of cold air’ from the continent that eventually gets ‘warmed out’; it’s been a very long time since we had a cold spell that’s been fuelled by a continual feed of air off the continent.

Screen Shot 2018-02-22 at 09.02.23
In 2018 the really cold air aloft had warmed after 5 days

To illustrate my point I had a look back at every cold spell in this area of suburban east London since 1960. I weeded out the feeble efforts of the last few years by only considering spells where the maximum didn’t exceed 2.8C. The results spanned from the most recent cold spell of February 2018 to the mammoth 31-day Siberian blast that began on Boxing Day 1962.

In another blog I remarked how similar the 2018 pattern was to February 1962. This cold spell began on the 26th and lasted 9 days. Some 7cm of snow fell, this drifting in the wind, possibly making it seem worse with only 4 hours of sunshine which would have maintained any snow cover.

One of the snowiest cold spells happened in February 2009, eight days after an SSW event that lead to a polar vortex split. This four day spell saw a total of 26cm of snow fall.

February 1991 was even snowier, the intense cold lasting some 11 days.

Looking at other February cold spells a 7-day spell occurred in 1985 about a month after an SSW event.

Overall the median length was 5 days with an average of 6cm of snow and 8hrs of sunshine.

*A survey of winters ranked for temperature and snow can be found here.

The severe cold spell of February 1991

The cold spell of February 1991 saw unusually deep snowfall in central London. The 20cm recorded at St James’s Park on the 8th was the greatest cover recorded at the site since the severe winter of 1962/63.

summ821991
Courtesy of the Met Office

My own memory of the event was that the synoptics evolved fairly quickly. I was away at university at the time and had to be back for a family event that weekend. After seeing a forecast predicting that a foot of snow was on the way I jumped on a train a day earlier than planned and returned to London. The following morning all hell had broken loose as deep snow paralysed public transport.

Snow fell on the following 6 days with no thawing as the temperature remained below zero until the 10th. The maximum of the 7th was -3C. By the 9th there was widely 20cm of level powdery snow lying. Getting around was difficult – I remember some drifts during walks into town were thigh high.

The month saw the three coldest February days of the last 60 years in central London.

By the end of the 19th all of the British Isles were snow free.

February 1991
February 1991 in suburban east London

The nine charts below show how a strong ridge of high pressure from an anticyclone over northern Sweden on the 5th brought very cold air and heavy snowfall over the following days.

These significant weather charts show the snow depths at noon from 6th to the 13th.


summ1021991
Courtesy of the Met Office

Ian McCaskill’s late evening BBC forecast on February 6th.

Francis Wilson’s breakfast telly forecast on February 7th 1991: “Temperatures rising from -11 to -5C. Depths in excess of a foot. It’s all downhill from now.”

Harlow, Essex, during the cold spell.

Murphy’s winter and weather prophets

It is 180 years ago this month that Patrick Murphy shot to fame after successfully predicting one of the coldest Januaries on record.

murphy
anon, “The Modern Phenomenon of a Murphy the Gullcatcher of 1838” London Saturday Journal

The month, which had started mild, completely changed during the weekend of the 8th as a SE’ly wind set in. Hard frosts and snow became a daily feature with considerable falls across Scotland, disrupting mail and causing hardship for people and livestock.

By the 20th some of the lowest temperatures of the 19th century were recorded in London. At Greenwich -16C (-11C at midday) was reported at sunrise, while Blackheath saw -20C and Beckenham -26C. By the 27th the Thames at Greenwich was completely covered with ice at high water and elsewhere in the estuary ice floes were reported.

In some parts of northern Scotland, snow was noted to fall on most days between January 8th and May 3rd. Snow was also noted in upland areas of NE Scotland in June.

‘Murphy’s Winter’ as it became known made the astrologer from Cork a small fortune from the sale of an almanac, the contents of which also successfully listed the actual date when the frost would be at its most severe.

It was possibly the first long-range weather prediction that people through the ages seem to love, whether they are right or wrong.

Many characters have emerged over the years. Yorkshire’s Bill Foggitt, who used natural signals and animal behaviour during the previous autumn, was popular in the 1980s especially when he made a prediction of a harsh winter.

Others, including the Daily Express, who probably shouldn’t be mentioned in the same breath as Foggitt, are more about the clicks they hope to generate for their publishers than any earnest attempt at being right.

  • The mean temperature locally in January 1838 was -1.5C, the second coldest January in a series going back to 1797, and as cold as January 1963.
  • mean